We can't find the internet
Attempting to reconnect
Something went wrong!
Hang in there while we get back on track
We can't find the internet
Attempting to reconnect
Something went wrong!
Hang in there while we get back on track
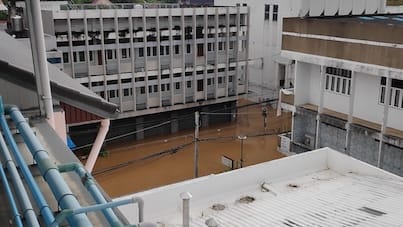
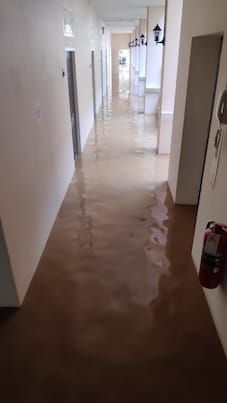
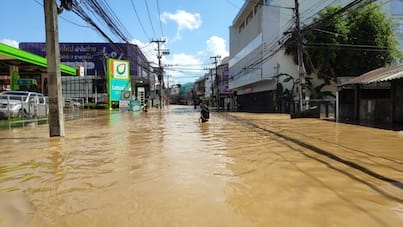
In October 2024, I got first-hand experience of the floods in Chiang Mai. Aside from the inconvenience of rearranging my accommodation and wading through dirty waist-deep water, I was fortunate not to suffer any major harm or consequences.
Still, these were a series of very uncertain days. The Chiang Mai News in English Facebook group was a great resource, helping me navigate what was happening. Through that group I found out about the Thai's official depth and discharge data, updated hourly. This is already a very helpful resource, but I thought it'd be fun to try to display that data as a chart.
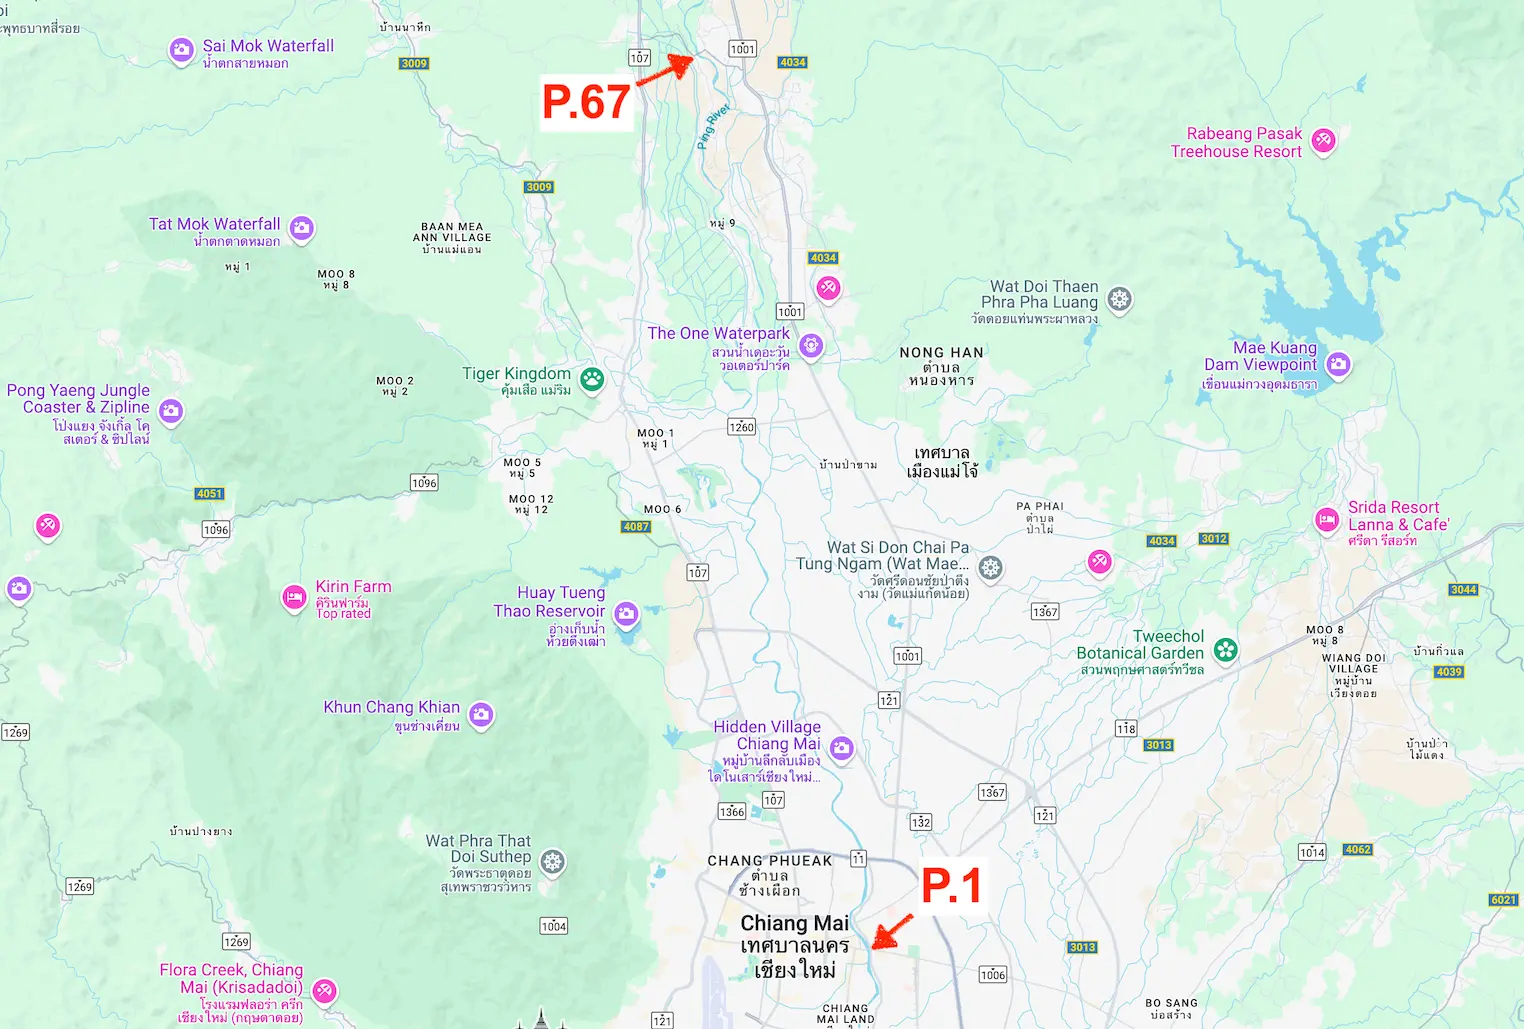
Right now, this site only gathers data from station P.1, located next to Nawarat Bridge, and station P.67, which is further upstream. The Royal Irrigation Department provides a map with the location of all their stations.
I built this site as a fun learning project. Please keep in mind that the information presented here is provided "as is", without warranty of any kind. There could be bugs that produce inaccurate information, so always check the official data sources if you need stronger assurance.
Having said that, I'll do my best to keep this site as a useful resource. The code is open source and available on GitHub. If you have feedback, you can open an issue. Enjoy!